bigfunctions > explore_column
explore_column
Call or Deploy explore_column
?
✅ You can call this explore_column
bigfunction directly from your Google Cloud Project (no install required).
- This
explore_column
function is deployed inbigfunctions
GCP project in 39 datasets for all of the 39 BigQuery regions. You need to use the dataset in the same region as your datasets (otherwise you may have a function not found error). - Function is public, so it can be called by anyone. Just copy / paste examples below in your BigQuery console. It just works!
- You may prefer to deploy the BigFunction in your own project if you want to build and manage your own catalog of functions. This is particularly useful if you want to create private functions (for example calling your internal APIs). Discover the framework
Public BigFunctions Datasets:
Region | Dataset |
---|---|
eu |
bigfunctions.eu |
us |
bigfunctions.us |
europe-west1 |
bigfunctions.europe_west1 |
asia-east1 |
bigfunctions.asia_east1 |
... | ... |
Description
Signature
explore_column(fully_qualified_column)
Description
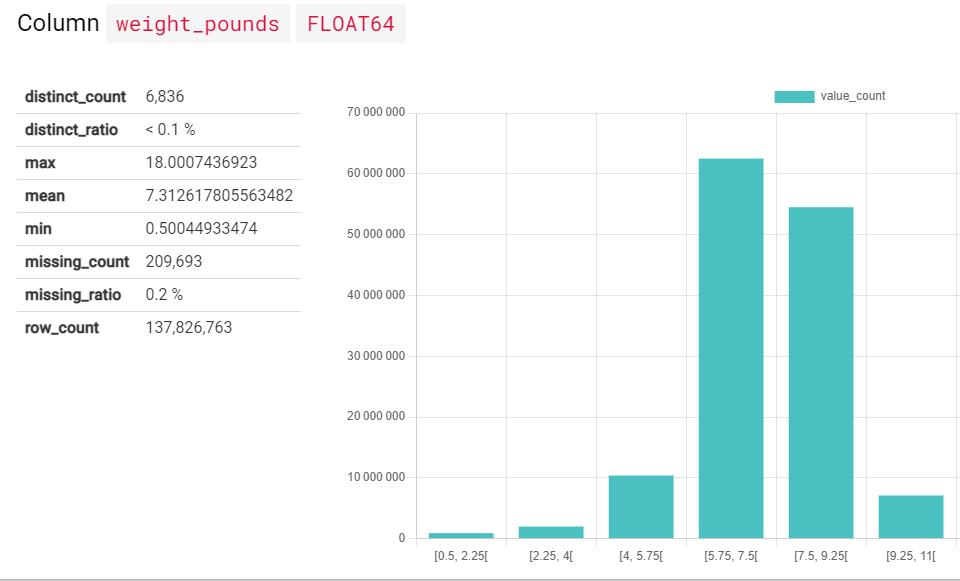
Show column statistics
See the result as a data visualization in BigQuery Console!
The result of this function can be vizualized as an html report directly in BigQuery Console!
- Install this bookmarklet: bigfunctions (it has to be done only once)
- Open BigQuery console
- Click on the installed bookmarklet.
- From now on, the bookmarklet code will observe the BigQuery console page.
- If a BigQuery result appears with a unique cell containing html content, it will be rendered.
- You will have to click on the bookmarklet again:
- If you refresh the Bigquery console page,
- If you open the BigQuery console in a new tab of your browser.
- Run the query of the example and open the result of the latest subquery. The result will be shown as a nice html content.
Examples
call bigfunctions.eu.explore_column("bigfunctions.eu.natality.weight_pounds");
select html from bigfunction_result;
call bigfunctions.us.explore_column("bigfunctions.us.natality.weight_pounds");
select html from bigfunction_result;
call bigfunctions.europe_west1.explore_column("bigfunctions.europe_west1.natality.weight_pounds");
select html from bigfunction_result;
Need help using explore_column
?
The community can help! Engage the conversation on Slack
For professional suppport, don't hesitate to chat with us.
Found a bug using explore_column
?
If the function does not work as expected, please
- report a bug so that it can be improved.
- or open the discussion with the community on Slack.
For professional suppport, don't hesitate to chat with us.
Use cases
The explore_column
function, as described, provides statistics about a specified column in a BigQuery table. Here are a few use cases:
-
Data Understanding/Exploration: When working with a new dataset, you can quickly use
explore_column
to get a sense of the distribution of values within a particular column. This helps understand data types, ranges, potential outliers, and the general characteristics of the data. For example, if you have a column representing customer ages,explore_column
could show you the average age, minimum and maximum ages, and potentially a histogram of the age distribution. -
Data Quality Assessment:
explore_column
can help identify data quality issues. For instance, it might reveal unexpected values in a column (e.g., negative values in a column supposed to store positive numbers), a high number of NULL values, or a skewed distribution that might warrant further investigation. -
Feature Engineering: Before using a column in a machine learning model,
explore_column
can help determine appropriate preprocessing steps. For example, if a column has a highly skewed distribution, you might decide to apply a logarithmic transformation. Understanding the distribution can also help you choose appropriate binning strategies for categorical features. -
Report Generation: The function generates HTML output which can be incorporated into automated reports. This allows for easy sharing of column-level statistics with stakeholders without manual analysis.
-
Data Monitoring: By periodically running
explore_column
on key columns, you can monitor changes in data distributions over time. This can be useful for detecting anomalies or drifts in the data that might indicate problems with data ingestion or underlying business processes.
Example Scenario:
Imagine you're analyzing a dataset of website user activity. You have a column called time_spent_on_page
(in seconds). Using explore_column(your_project.your_dataset.your_table.time_spent_on_page)
would quickly provide you with stats like the average, minimum, maximum time spent on a page, potentially a histogram visualization, and help you answer questions like:
- Are there users spending an unusually long or short time on the page?
- Is the distribution skewed? Are most users spending a short time, with a few outliers spending a very long time?
- Are there a significant number of NULL values, indicating potential tracking issues?
Based on this information, you can make decisions about data cleaning, feature engineering, or further investigation.
Spread the word
BigFunctions is fully open-source. Help make it a success by spreading the word!